
Introducing Clarivize
The easiest way to tame your telemetry bill

The observability status quo
First we started to monitor applications.
Now we're trying to monitor observability invoices.
Welcome to the next Observability battle:
"The War of Hidden Costs.” - Cansel Ö.
This quote perfectly captures the present state of observability. Every major player in the niche contributes to the status quo in various ways, and customers are told all of the data is necessary to keep the applications running.
In reality, telemetry data often contains a good deal of redundancies and excess. Here are a few examples I've found in default setups:
Multiple attributes with the same value, attached to the same item (log, metric or trace)
Attributes that can cause cardinality explosion for no good reason - process ID can change on restart, yet some default configurations include it as a resource attribute on every item, when it should be a log line. A quick search in GitHub shows telemetry sdk versions are most often removed, but did you remove them in your pipeline?
Container/VM IDs with 40+ random hex characters, recorded as a string. 40 bytes doesn't sound like much, until you realize every single item has it, and there are a million items per hour. In reality 10-12 hex characters would suffice in most cases.
Scraped logs containing text that is already extracted into attributes.
Metric descriptions emitted with every data point, often much larger than the data point itself.
Generative AI telemetry with OTel repeating the entire conversation for every new line. Use it in prod at your own risk.
How about what is collected? Does your application collect metrics you've never used? Or metrics that rarely (if ever!) change, being emitted every minute?
Conveniently, your observability provider will readily accept your redundant data. The more redundant it is - the better it compresses and indexes, costing very little to store and query on their end. Of course, they charge the uncompressed ingested size.
The fix
So how do you fix your telemetry data to extract maximum value for minimum cost?
There are tools, of course, many of them arcane and difficult to use, each with their own language and limitations. Take a peak at your observability pipeline - how many different tools are in it? A study from 2025 showed only 7% of customers used a single tool, 25% used 4 or more.
Shouldn't there be a single tool that can:
show you the data passing through your telemetry pipeline
aggregate each metric separately, based on how active it is
sample logs/metrics/traces intelligently, preserving related items wherever possible
apply attribute-level transformations
conditionally sample items in or out
redirect low-value items to cold storage
easier to use than app-specific transform languages
This is what I have been working on, and now I'm happy to share it with you:
Clarivize: a telemetry cost-control service that runs in your environment.

Clarivize was conceived as a tool to fix the kinds of problems I encountered while working at Microsoft's Application Insights team, where I often needed to dig through heavily sampled and broken telemetry. Yes, even the team that makes some of the best tools in the industry has their own struggles.
In a nutshell, Clarivize is a service that runs in your environment, and can be added as a "processor" in your telemetry pipeline, similar to how OpenTelemetry tools are deployed. This means your telemetry data stays safe in your environment.
It can receive telemetry using OTLP or Application Insights protocols.
The received telemetry can be sampled and aggregated intelligently. Sampling bin size can be determined dynamically, based on data variability, which saves data for near-constant metrics, while retaining the resolution for high-variability metrics.
Clarivize can detect anomalous data points and let them skip the sampling process. Additionally, if the anomalous data point contains a link ID (operation, span, trace, session IDs), other items that contain the ID can skip the sampling process as well. This preserves data that may be needed for troubleshooting or analysis.
A variety of custom rules can be applied to determine sampling behavior or to modify attributes of the telemetry item.
All of these rules can be previewed with live data samples in Clarivize's UI, so you can be confident they will do exactly as intended, along with statistics on data savings and performance.
Rules can be a burden to write, so Clarivize analyzes your telemetry data in real time, finds common problems and offers recommendations that you can review and apply.
Once the telemetry is processed, it can be forwarded to another processor - or to your observability provider. Low-value data can be exported to cold storage, and I am working on some nifty features that I'll share with you as they become available.
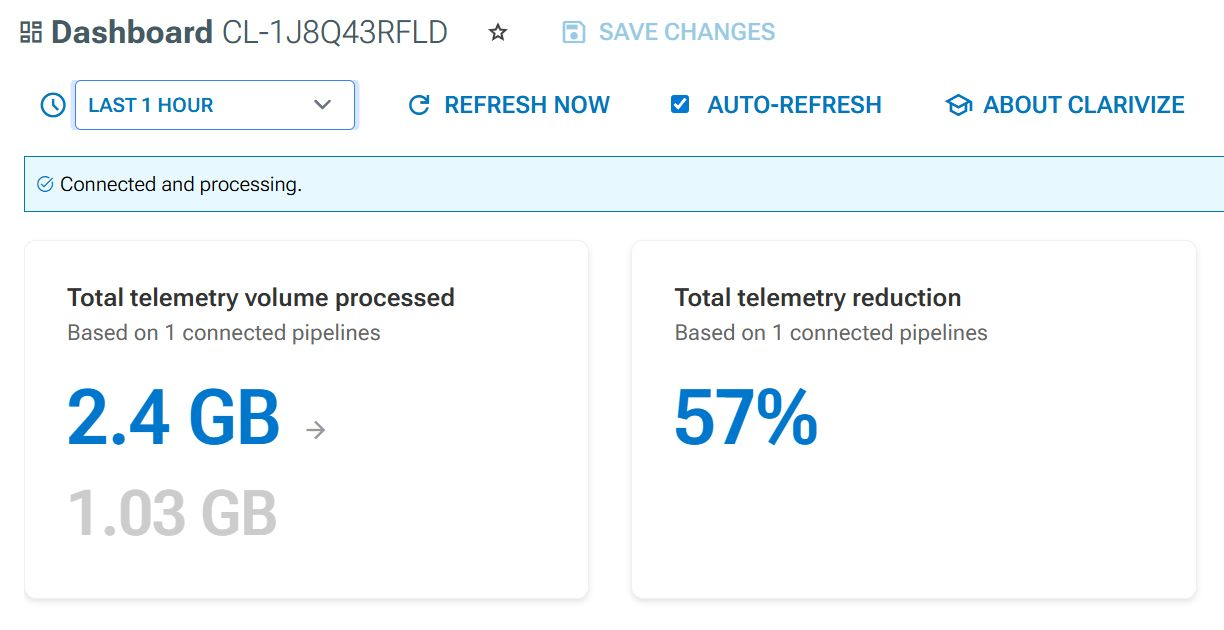
A question in the end: would saving 50%+ on your telemetry bill be worth an hour of your time? If yes - send us a message via LinkedIn or by email.
Comments
Join the discussionNo comments yet. Be the first to comment.